Leverage Social Data for Brand Guidelines | BrandKitOS
Your brand already speaks. Every post, caption, comment, and reply builds a public identity whether you're managing it or not. Most companies spend thousands defining their brand from scratch when months or years of authentic content already shows who they are. And who their audience thinks they are.
The gap between your intended brand and your perceived brand costs you. Static brand guidelines drafted in isolation miss the patterns, language, and values your content already demonstrates. By analyzing existing social profiles and published content, you extract real signals about voice, positioning, and engagement that no workshop can manufacture.
Why Your Social Profiles Are Better Brand Data Than Any Workshop
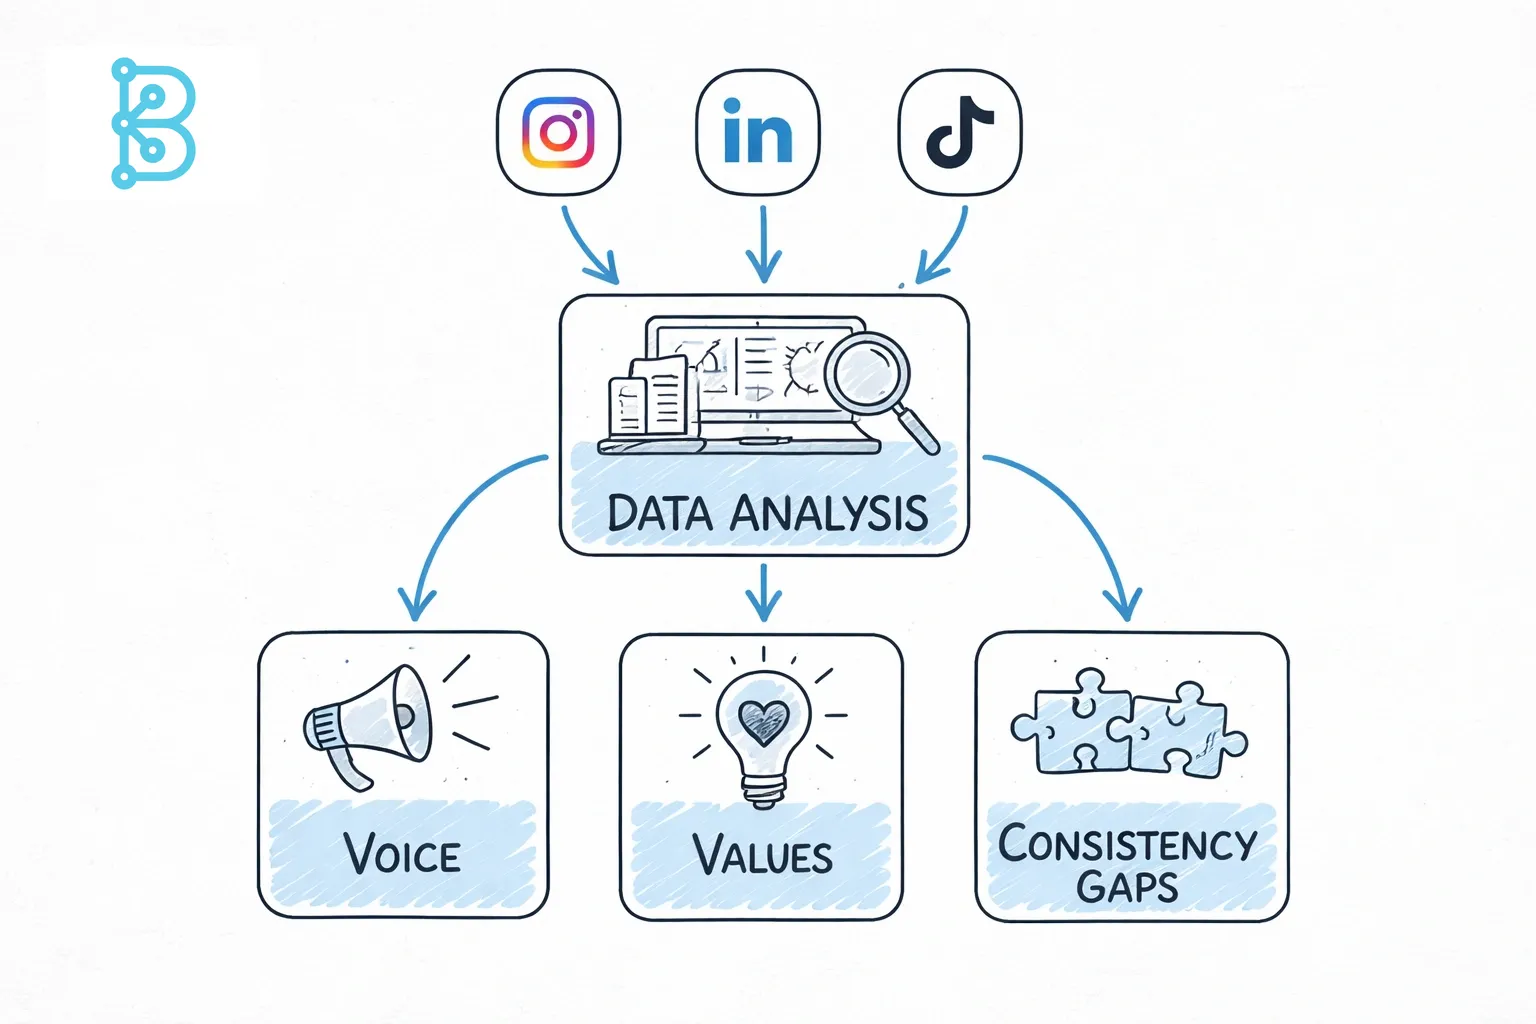
Social profiles contain behavioral truth. When you analyze Instagram, LinkedIn, or TikTok feeds, you see the actual language that drives engagement, the topics that resonate, and the tone that builds community. This data reflects thousands of micro-decisions about what to publish, how to respond, and which messages to amplify.
Workshops produce aspirational documents. Teams debate adjectives like "innovative" or "authentic" without evidence. Social data shows you which posts performed, which captions sparked conversation, and which visual styles stopped scrollers. That empirical foundation makes brand guidelines useful rather than decorative.
The content patterns reveal consistency gaps fast. If your Instagram sounds casual but your LinkedIn reads corporate, you've found misalignment before it fragments your market presence. If engagement peaks on educational posts but your strategy prioritizes promotional content, the data redirects your focus.
What Gets Revealed When You Analyze Your Existing Content
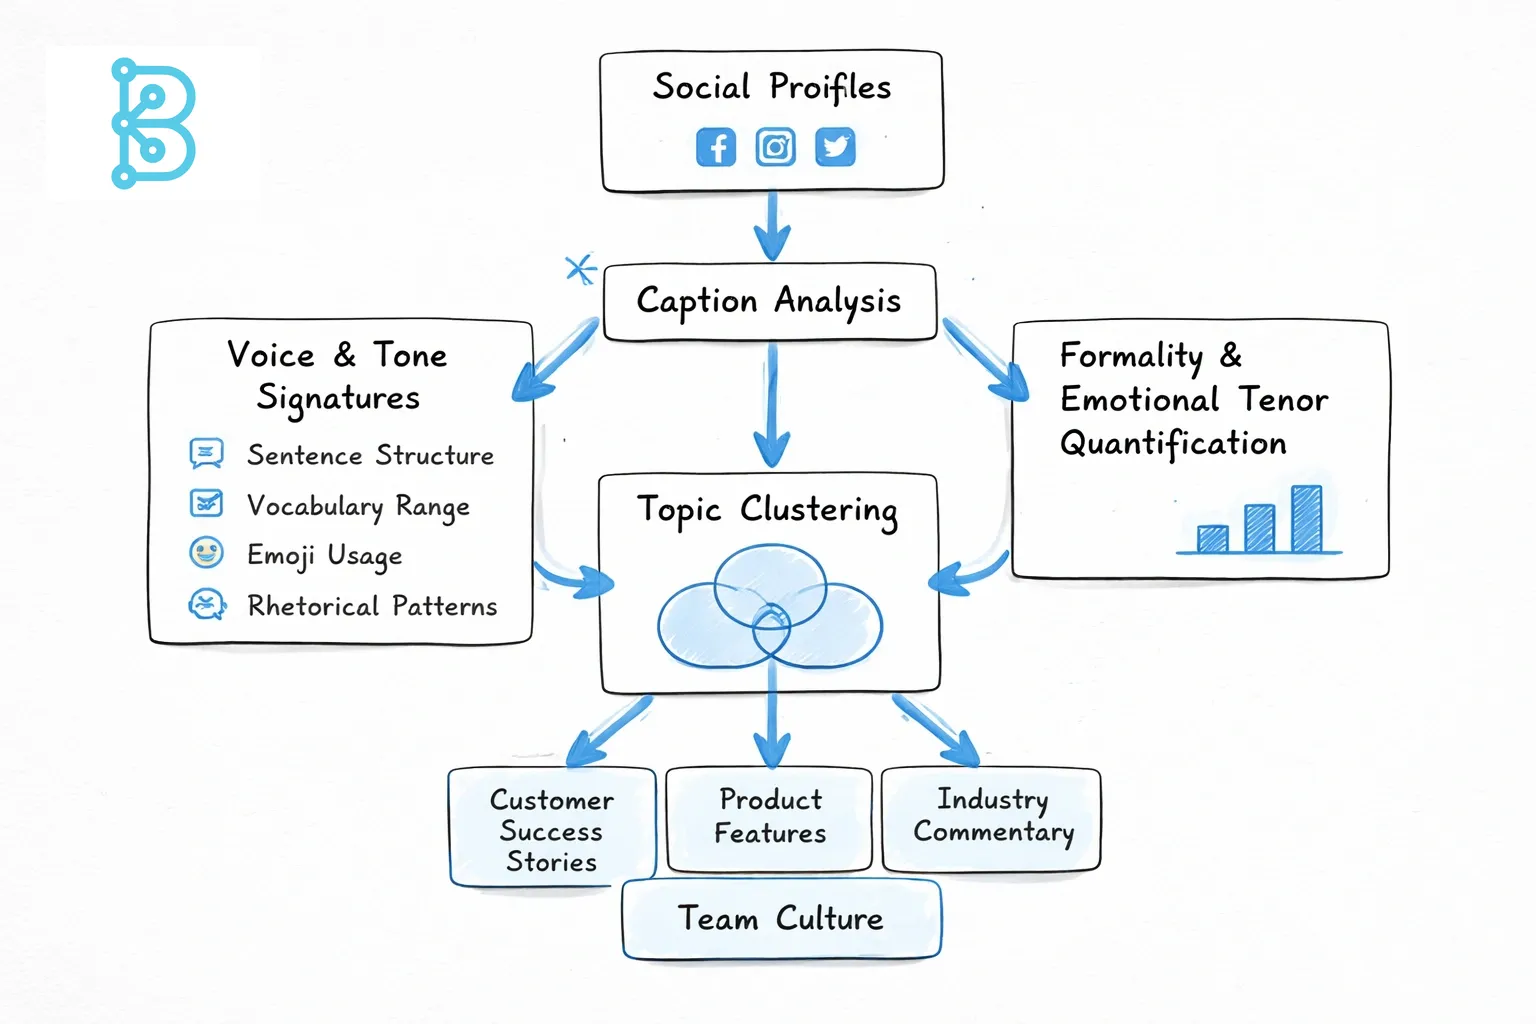
Voice and tone signatures emerge from caption analysis. Natural language processing identifies your sentence structure, vocabulary range, emoji usage, and rhetorical patterns. You discover whether you ask questions, make declarations, or tell stories. You quantify formality levels and emotional tenor across hundreds of interactions.
Value hierarchies surface through topic clustering. When you map which subjects dominate your feed customer success stories, product features, industry commentary, team culture you see what you actually prioritize versus what your mission statement claims. Frequency reveals true values.
Audience perception appears in engagement patterns. Comments, saves, and shares tell you which messages land. If your audience engages most with vulnerability but you post aspirational content, the disconnect becomes measurable. Our Instagram Analysis Wizard automates this pattern detection across posts, captions, comments, and reels.
Visual identity consistency gets quantified. Color palette frequency, filter usage, composition styles, and image subject matter can be extracted and compared against stated brand guidelines. Deviations become visible rather than subjective.
How to Turn Social Data Into Executable Brand Guidelines
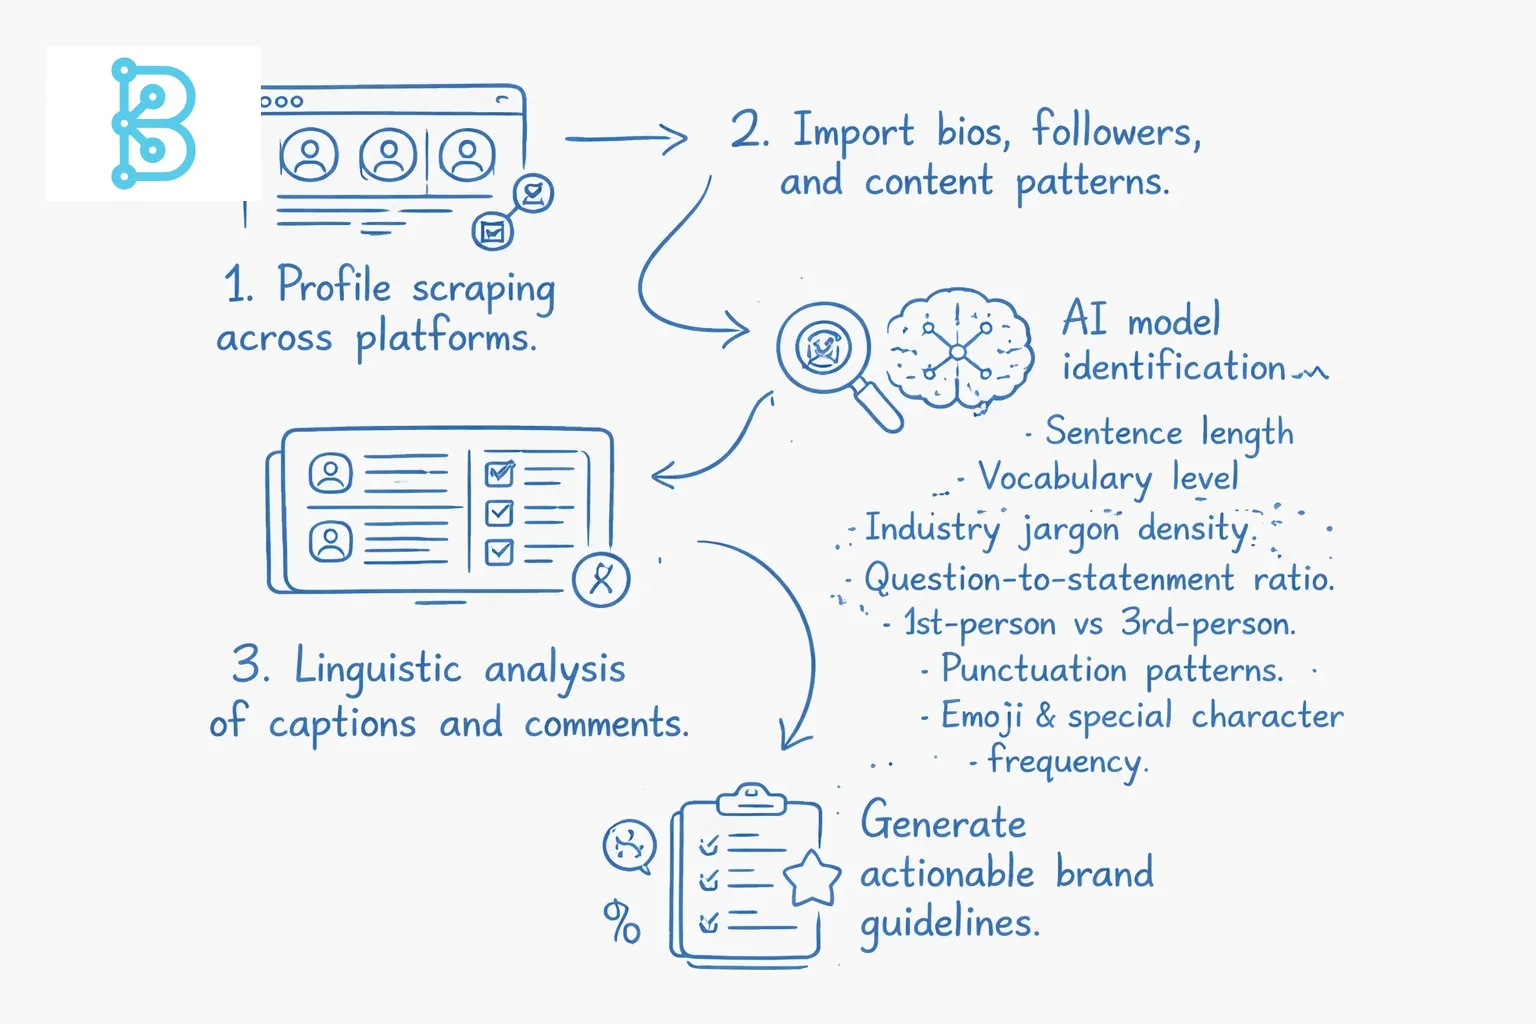
Start with profile scraping across active platforms. Pull the last 50-100 posts from each channel where you maintain regular presence. Include captions, comments, engagement metrics, timestamps, and media URLs. Connect your social profiles to import bio information, followers, and content patterns automatically.
Run linguistic analysis on text content. Use AI models to identify:
- Average sentence length and complexity
- Vocabulary level and industry jargon density
- Question-to-statement ratio
- First-person versus third-person usage
- Punctuation and formatting patterns
- Emoji and special character frequency
Map engagement to content attributes. Create a spreadsheet correlating post performance with:
- Topic category
- Post length
- Time of day published
- Visual type (photo, graphic, video)
- Caption tone (educational, inspirational, promotional)
- Call-to-action presence
Identify your top-performing archetypes. Which 10-15 posts got the highest engagement relative to your follower count? Extract common elements. Those become your proven brand expressions ones tested by actual audience response, not theoretical ones.
Document the patterns as executable rules. Instead of "we're approachable," write "we use questions in 40% of posts, maintain 8th-grade reading level, and respond to comments within 4 hours." Instead of "we're visual," specify "we